College of Engineering Unit:
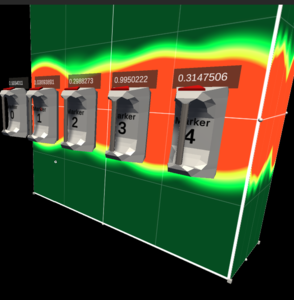
The Hololens Materials Stress Visualization is an AR project that displays a holographic representation of the stress on an object in the structural testing lab. It makes use of a Microsoft Hololens to display a heatmap on top of a real-world object then uses color to show which parts of the object is under the most stress. Additionally, it allows placing and seeing the location of sensors and their real-time value.</p>
This project exists so that the time between visualization and testing can be improved. Currently, engineers and researchers in the materials lab have to wait until after their test is completed to run the data through a computer visualization program. This means it is very difficult to get quick feedback about changes. To have live feedback of what is happening to the structure as it is happening will greatly improve the material research speed and give time back to the researchers and engineers to spend on more important tasks.
The project consists of three major components: C code to read in the serial data coming from the lab computer, a node.js webserver to make the data accessible to other computers on the local network, and a Unity project that runs on the Hololens and both pulls in the data from the node.js server and makes the holographic heatmap and sensors.
Project Website(s):
| Attachment | Size |
|---|---|
| 1.02 MB |